The Dashboard shows the store at a glance: sales, number of sales, margin, returns, low stock, a sales chart, payments by method and best sellers. Every figure opens the list behind it: click it, touch it, or press Enter on it. Esc comes back.
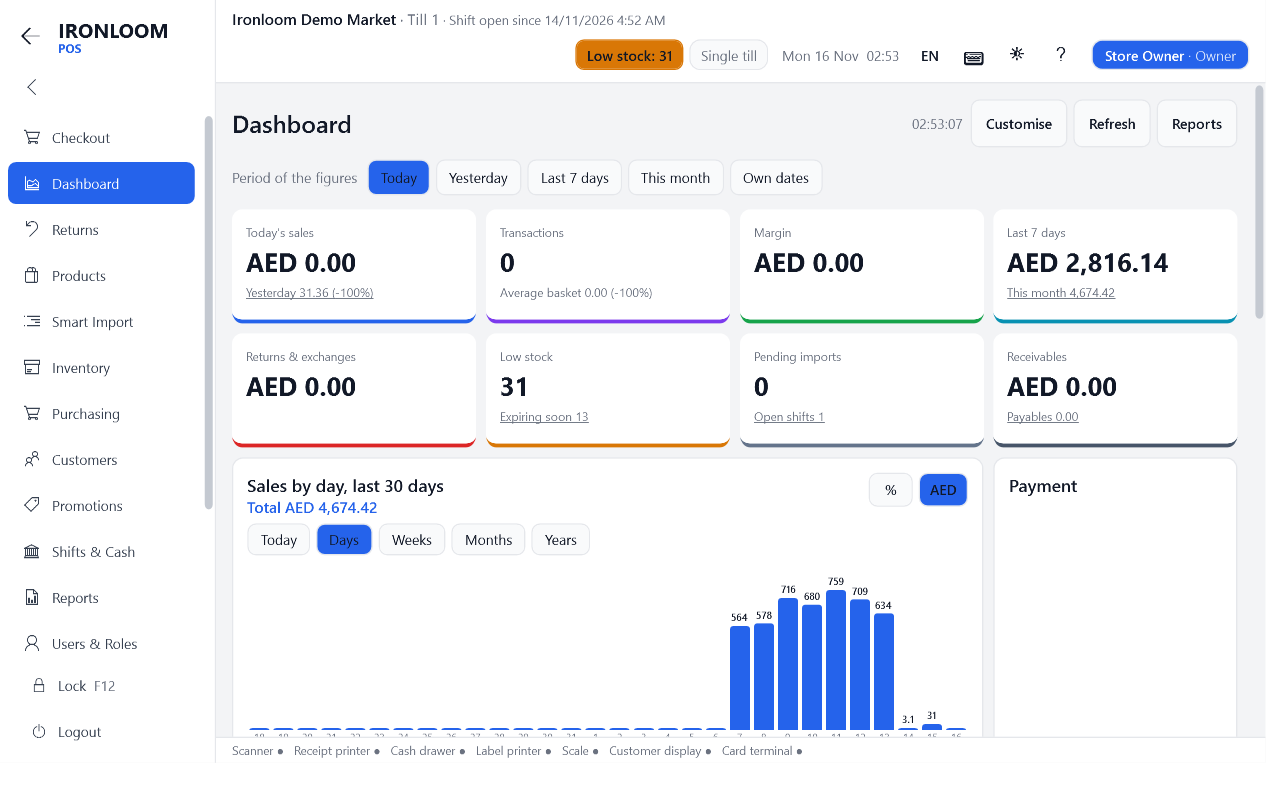
The figure cards
Today's sales, Transactions, Margin, Last 7 days, Returns, Low stock, Pending imports and Receivables. Most have a second line, such as the average basket or the change against the period before.
The blocks
| Block | What it shows |
|---|---|
| Sales chart | sales by hour today, or by day, week, month or year; the % and currency buttons choose what is written on the bars |
| Payment | the period's sales by payment method |
| Top products | the best sellers |
| Sales by cashier, Sales by department, Busy hours | who sold, what sold, and when |
| Cash and shifts | the open shifts with their expected cash, held sales waiting |
| Loss watch | discounts, voids, price changes, drawer openings without a sale, items sold under cost: see How do I keep an eye on discounts, voids and other ways money can be lost? |
| Stock watch | out of stock, to reorder, dead stock, stock value, next expiry dates |
| Purchasing and money | orders to receive, supplier invoices due, tax collected, gift cards and store credit still owed |
| Customers and orders | new customers, open orders and deliveries |
| Alerts | devices, backup, licence, till sync, product lookups waiting |
| Daily target | progress towards the day's sales target |
- Each block appears only if your role may see its data. A cashier's Dashboard is not the owner's.
- A bar of the chart opens the receipts of that hour, or the sales report of that day, week, month or year.
- The period of the figures can be changed: see How do I see yesterday or this month on the Dashboard, and set a daily sales target?. The blocks can be moved, resized and hidden: see How do I arrange the Dashboard the way I want it?.